Covid19 Data Analysis with SQL
In this project we analyzes Covid19 Dataset with SQL.
This project involved importing a dataset from Excel to SQL Server and then
cleaning and analyzing the data to identify trends and insights, and finally building a dashboard with charts & graphs to showcase the results we got.
Cleaning & Processing
To begin, we start analyzing and exploring the data by performing these analysis:
- Show the likelihood of dying of you contract Covid
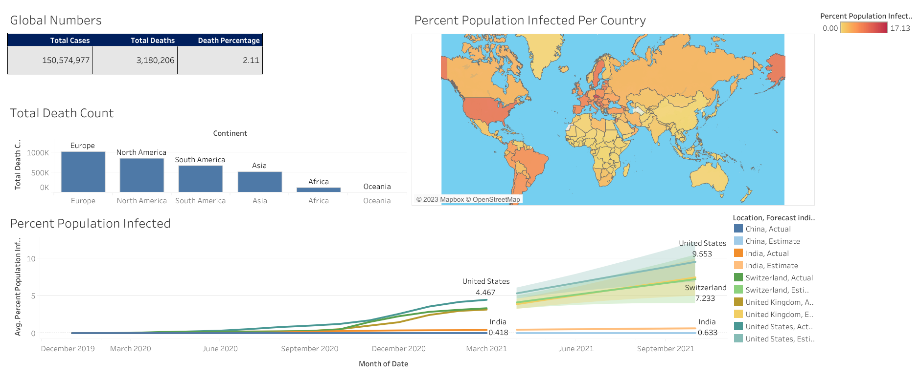
-Shows what percentage of population got Covid
-Looking at countries with the highest infection rate compared to population
-Showing countries with the highest death percentage
-Showing countries with the highest death count
-Looking at total population vs vaccinations
-Creating view to store data for later visualizations
Visualizations
Once the data is cleaned and organized, We used SQL queries and functions to analyze the data and identify patterns and trends. I then presented the results with Tableau through charts and graphs, which allowed us to communicate my findings in an engaging and easy-to-understand format.
Code
All the files used for this project can be found Here