Apple Stock Financial Analysis
In this Project we analyzed Apple's stock price data using Python and the 'yfinance' package.
The Python code retrieves the data, cleans it,
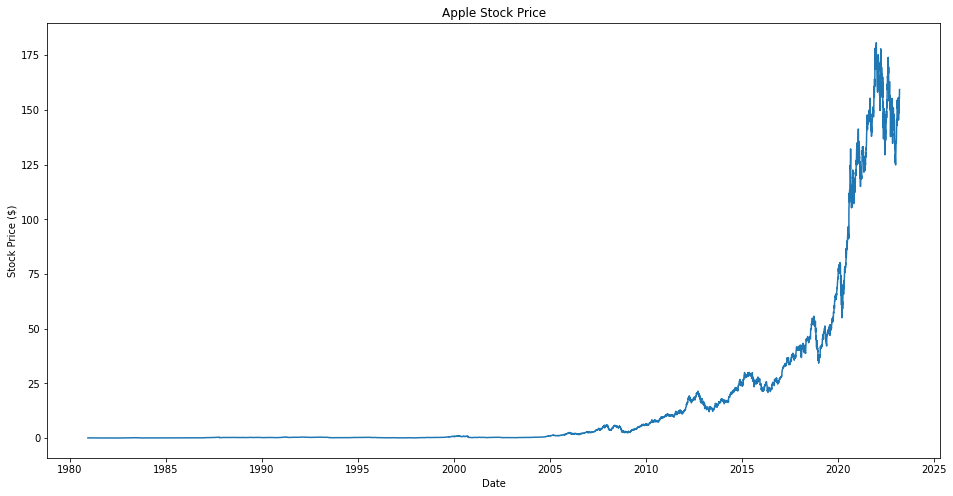
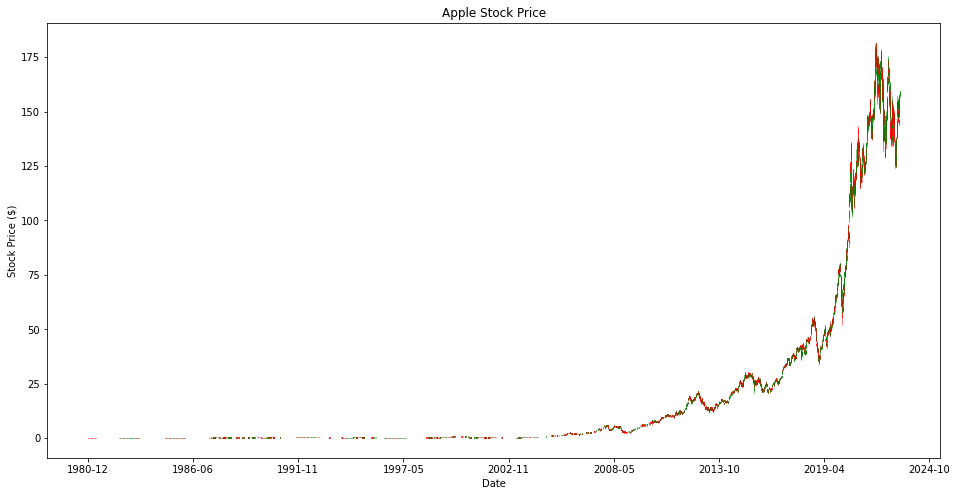
then visualized the stock price over time using a line plot and candlestick chart
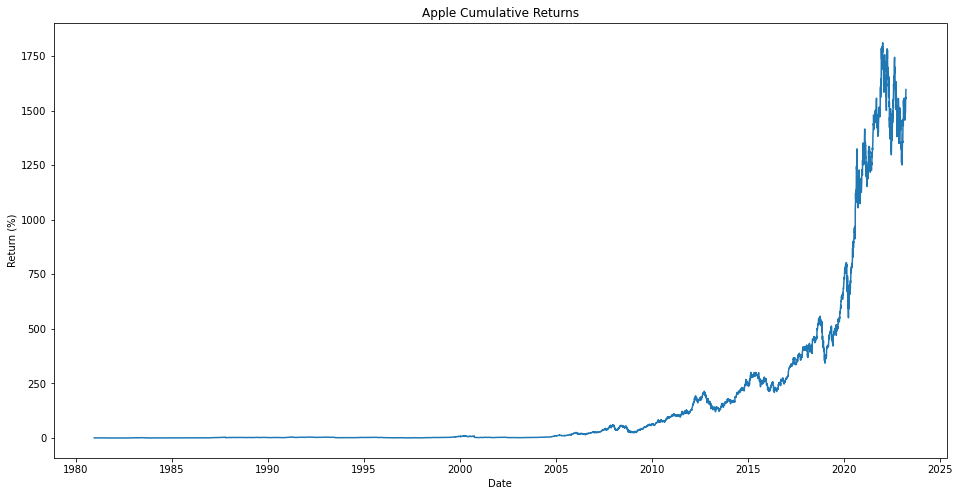
Next, we calculated the daily returns and volatility of the stock,
and plotted its cumulative returns.
We then used a histogram and density plot to visualize the distribution of daily returns,
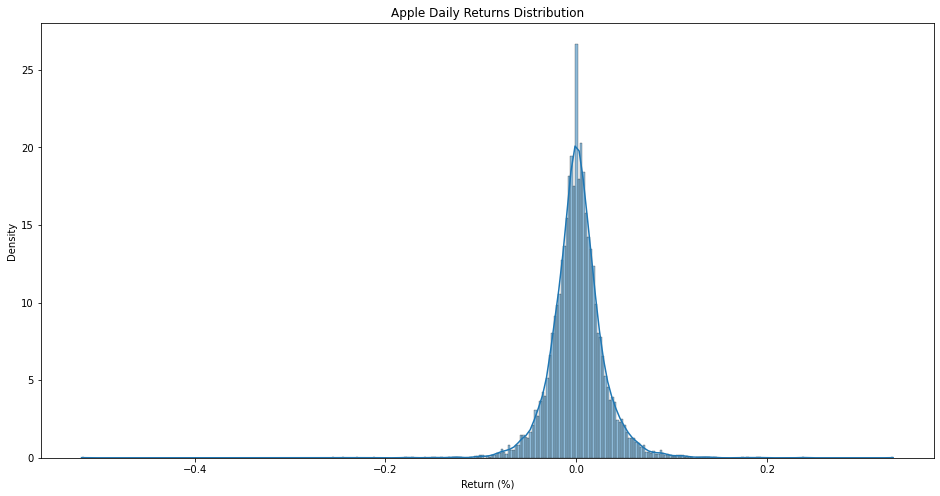
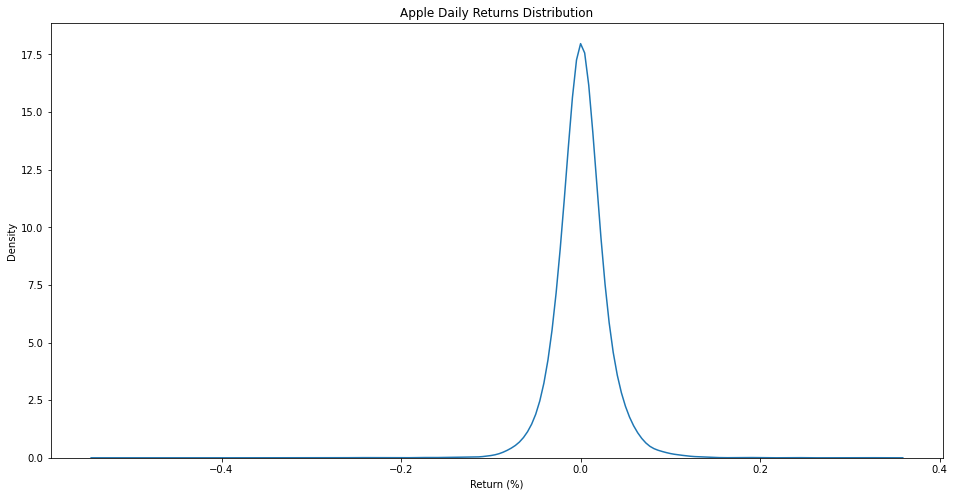
and performed a normality test to assess whether the returns follow a normal distribution.

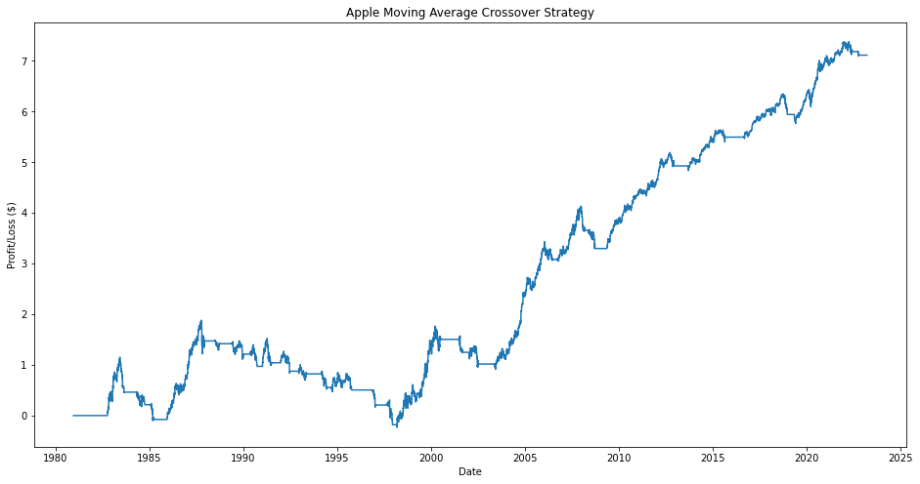
We also implemented a Moving Average Crossover strategy to generate buy/sell signals based on the stock's 50-day and 200-day moving
averages, and calculated the daily profit/loss based on these signals.
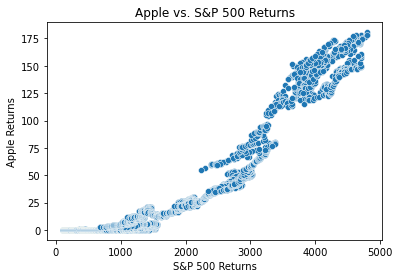
We then examined the correlation between Apple's stock returns and those of the S&P 500
using a scatter plot and correlation coefficient.
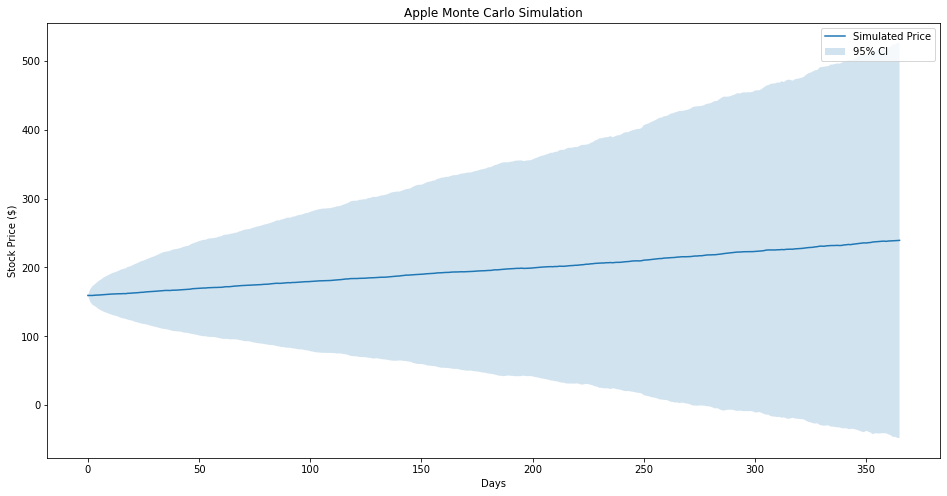
Finally, We performs a Monte Carlo simulation to predict future Apple stock prices based on historical daily returns.
Code
The Python code for this project can be found Here